第五章:Matplotlib
安装 Matplotlib 库
# 执行以下命令
pip install matplotlib
初级绘制
步骤
- 创建一个图纸(
figure) - 在图纸上创建一个或多个绘图(
plotting)区域(也叫子图、坐标系 / 轴) - 在
plotting区域上描绘点、线等各种marker - 为
plotting添加修饰标签(绘图线上的或坐标轴上的) - 其他各种
DIY
使用默认配置
from pylab import *

X = np.linspace(-np.pi, np.pi, 256, endpoint=True)
C, S = np.cos(X), np.sin(X)
plot(X, C)
plot(X, S)
show()
运行结果

改变线条的颜色和粗细
from pylab import *

X = np.linspace(-np.pi, np.pi, 256, endpoint=True)
colors = [" blue", "green", "red", "cyan", "magenta", "yellow", "black"]
C, S = np.cos(X), np.sin(X)
figure(figsize=(10, 6), dpi=80)
plot(X, C, color="blue", linewidth=2.5, linestyle="-")
plot(X, S, color="red", linewidth=2.5, linestyle="-")
plot(X, C)
plot(X, S)
show()
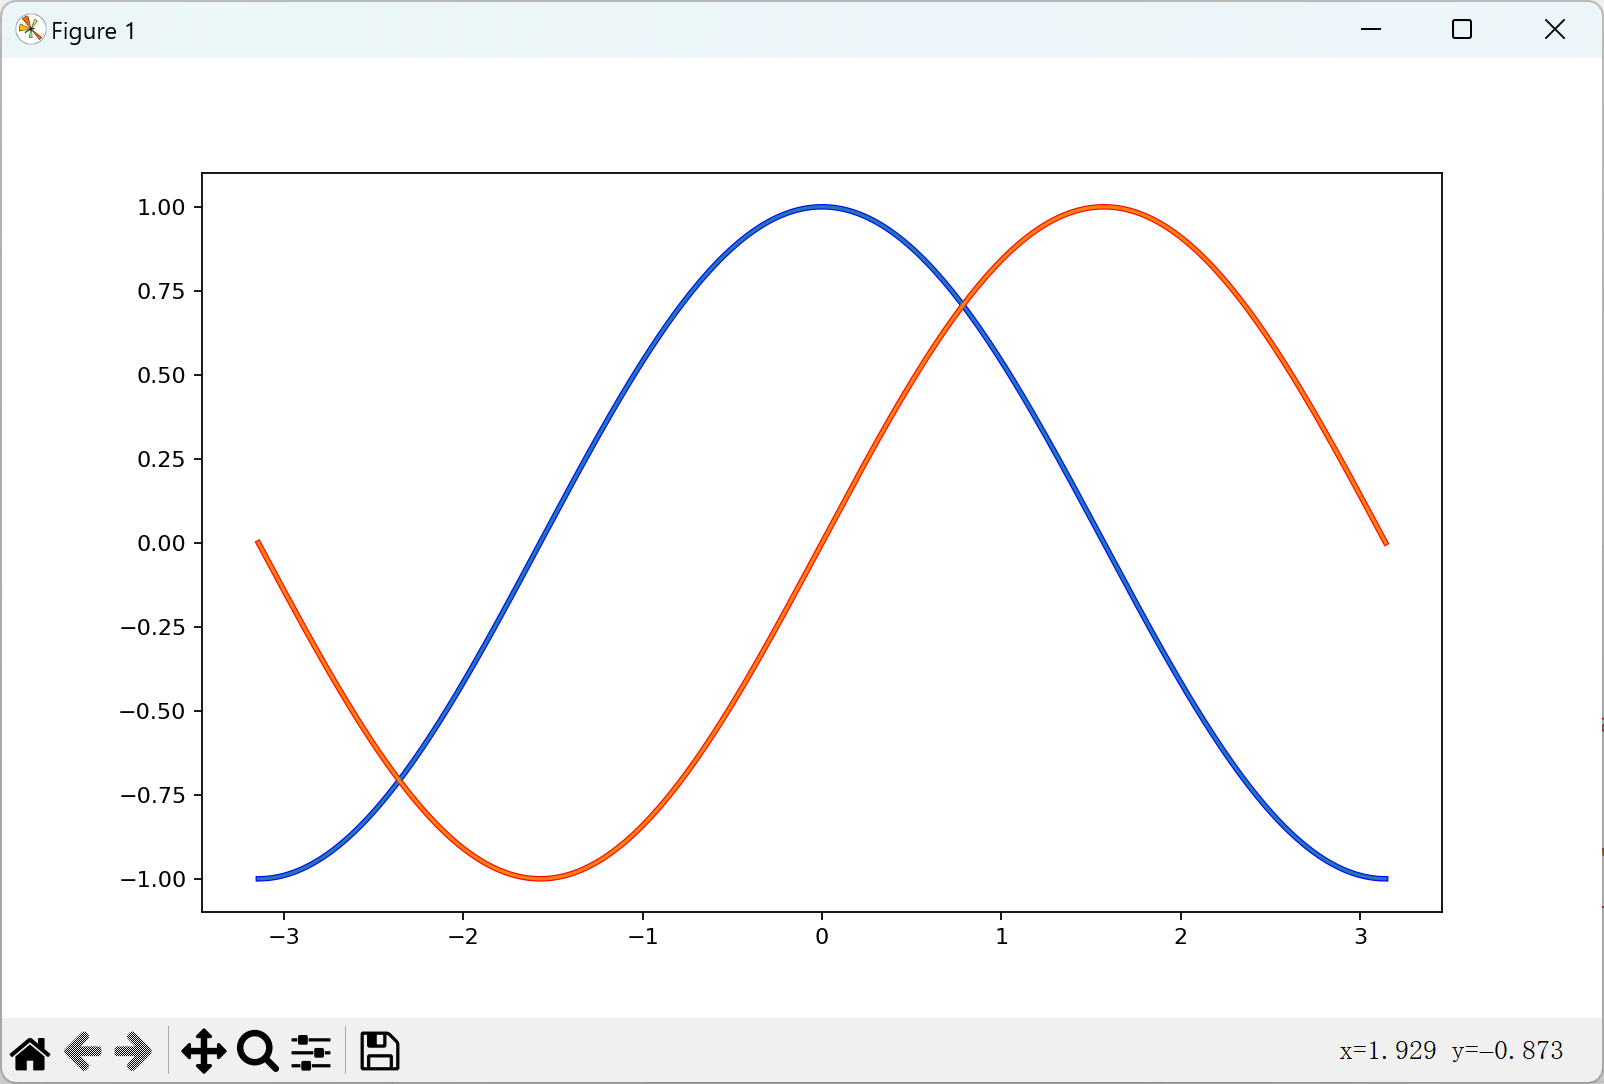
运行结果
设置边界
from pylab import *

X = np.linspace(-np.pi, np.pi, 256, endpoint=True)
colors = [" blue", "green", "red", "cyan", "magenta", "yellow", "black"]
C, S = np.cos(X), np.sin(X)
figure(figsize=(10, 6), dpi=80)
plot(X, C, color="blue", linewidth=2.5, linestyle="-")
plot(X, S, color="red", linewidth=2.5, linestyle="-")
plot(X, C)
plot(X, S)

# 设置边界值
xlim(X.min() * 1.1, X.max() * 1.1)
ylim(C.min() * 1.1, C.max() * 1.1)

# 设置数轴刻度范围
xlim(-10.0, 10.0)
ylim(-2.0, 2.0)

show()
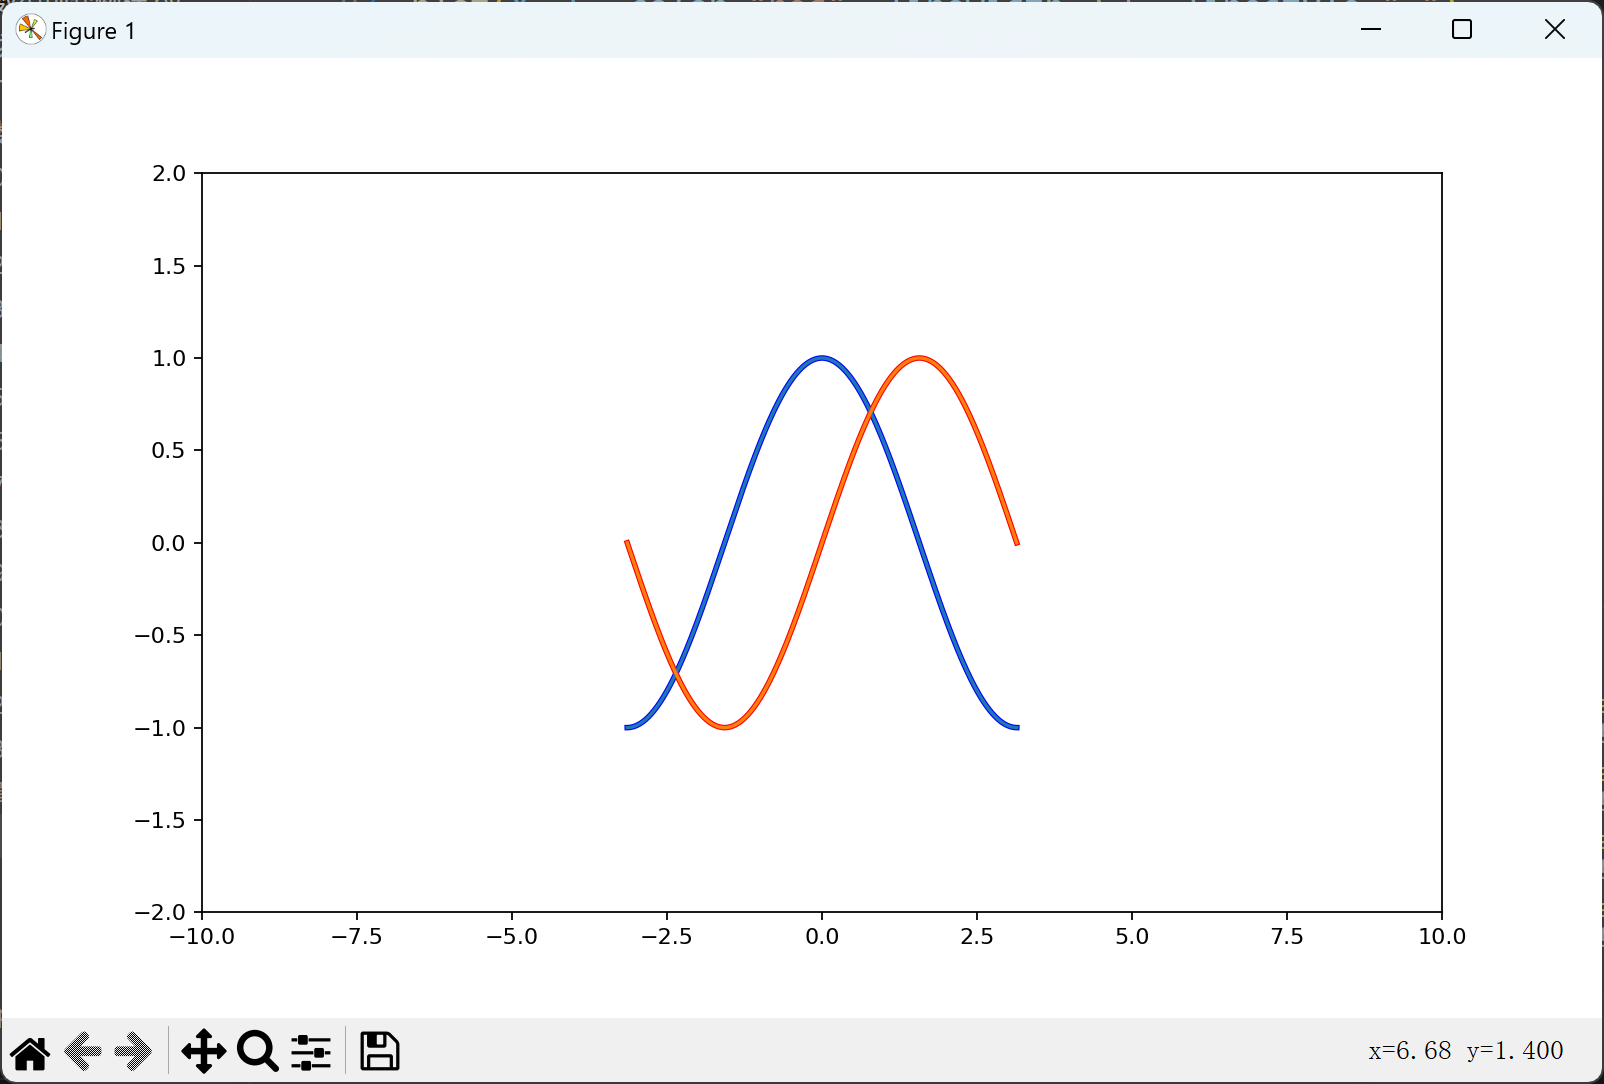
运行结果
设置刻度
from pylab import *

X = np.linspace(-np.pi, np.pi, 256, endpoint=True)
colors = [" blue", "green", "red", "cyan", "magenta", "yellow", "black"]
C, S = np.cos(X), np.sin(X)
figure(figsize=(10, 6), dpi=80)
plot(X, C, color="blue", linewidth=2.5, linestyle="-")
plot(X, S, color="red", linewidth=2.5, linestyle="-")
plot(X, C)
plot(X, S)

# 设置边界值
xlim(X.min() * 1.1, X.max() * 1.1)
ylim(C.min() * 1.1, C.max() * 1.1)

# 设置数轴刻度范围
xlim(-10.0, 10.0)
ylim(-2.0, 2.0)

# 设置数轴刻度值
xticks([-np.pi, -np.pi / 2, 0, np.pi / 2, np.pi])
yticks([-1, 0, +1])

show()
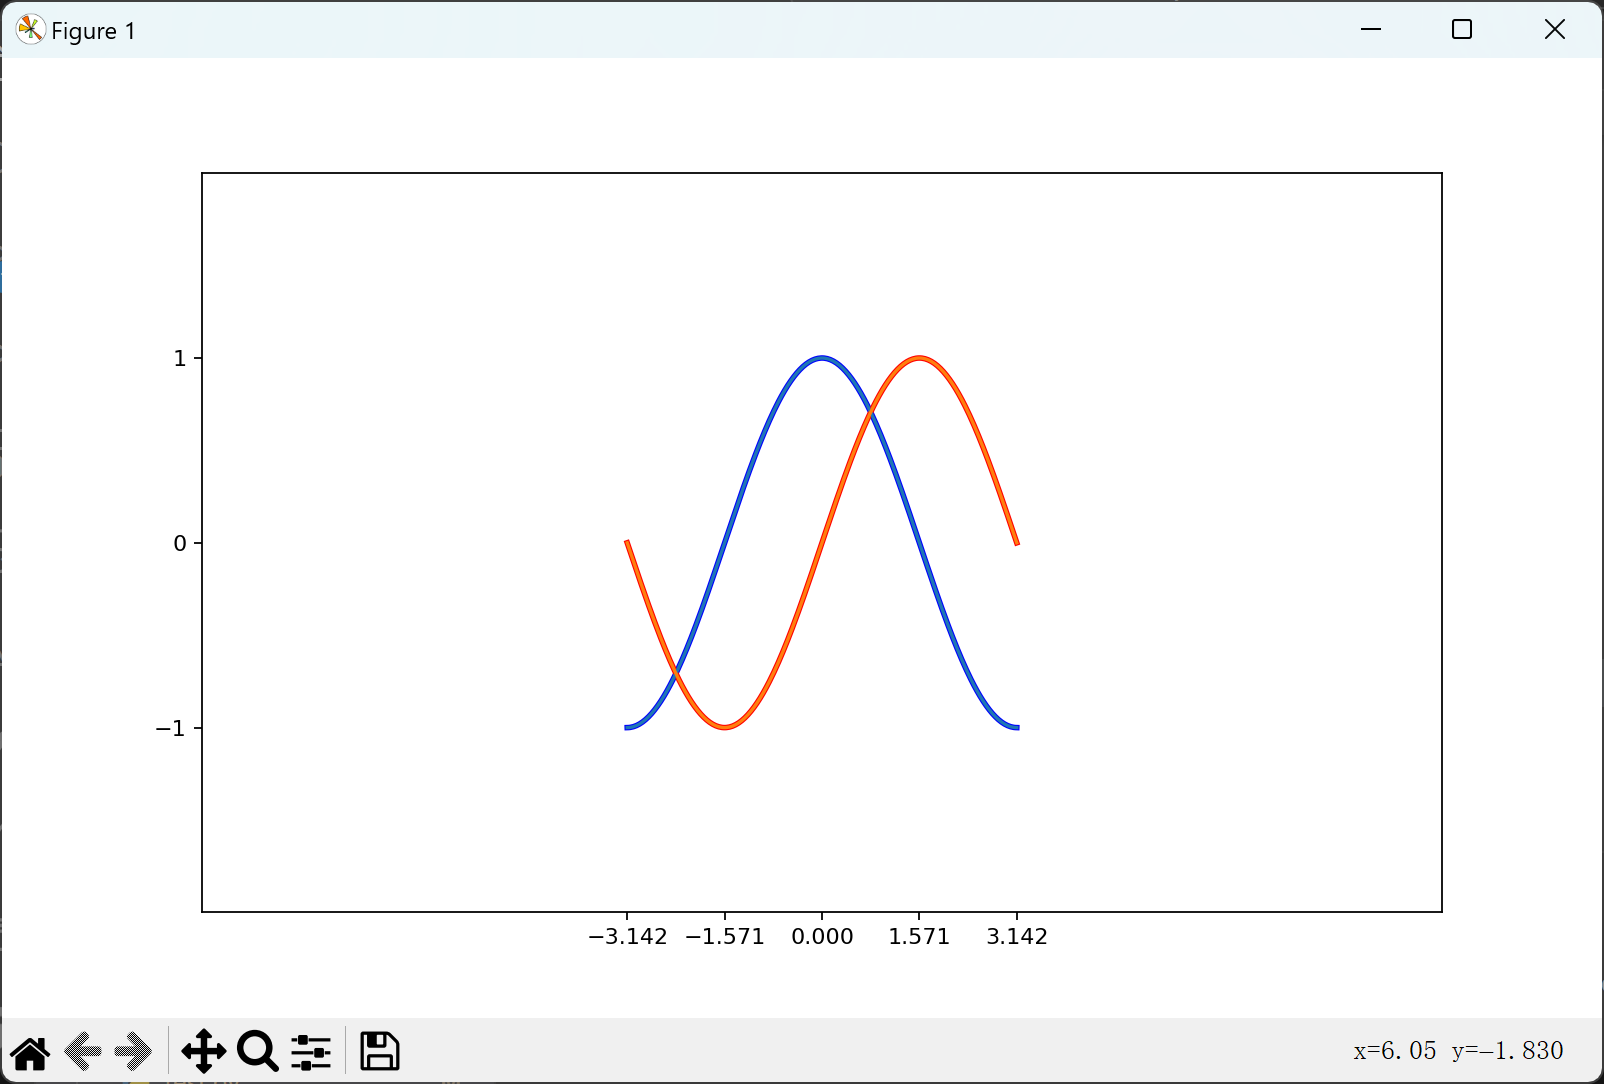
运行结果
设置刻度标签
from pylab import *

X = np.linspace(-np.pi, np.pi, 256, endpoint=True)
colors = [" blue", "green", "red", "cyan", "magenta", "yellow", "black"]
C, S = np.cos(X), np.sin(X)
figure(figsize=(10, 6), dpi=80)
plot(X, C, color="blue", linewidth=2.5, linestyle="-")
plot(X, S, color="red", linewidth=2.5, linestyle="-")
plot(X, C)
plot(X, S)

# 设置边界值
xlim(X.min() * 1.1, X.max() * 1.1)
ylim(C.min() * 1.1, C.max() * 1.1)

# 设置数轴刻度范围
xlim(-10.0, 10.0)
ylim(-2.0, 2.0)

# 设置刻度标签
xticks(
    [-np.pi, -np.pi / 2, 0, np.pi / 2, np.pi],
    [r"$-\pi$", r"$-\pi/2$", r"$0$", r"$+\pi/2$", r"$+\pi$"],
)
yticks([-1, 0, +1], [r"$-1$", r"$0$", r"$+1$"])


show()
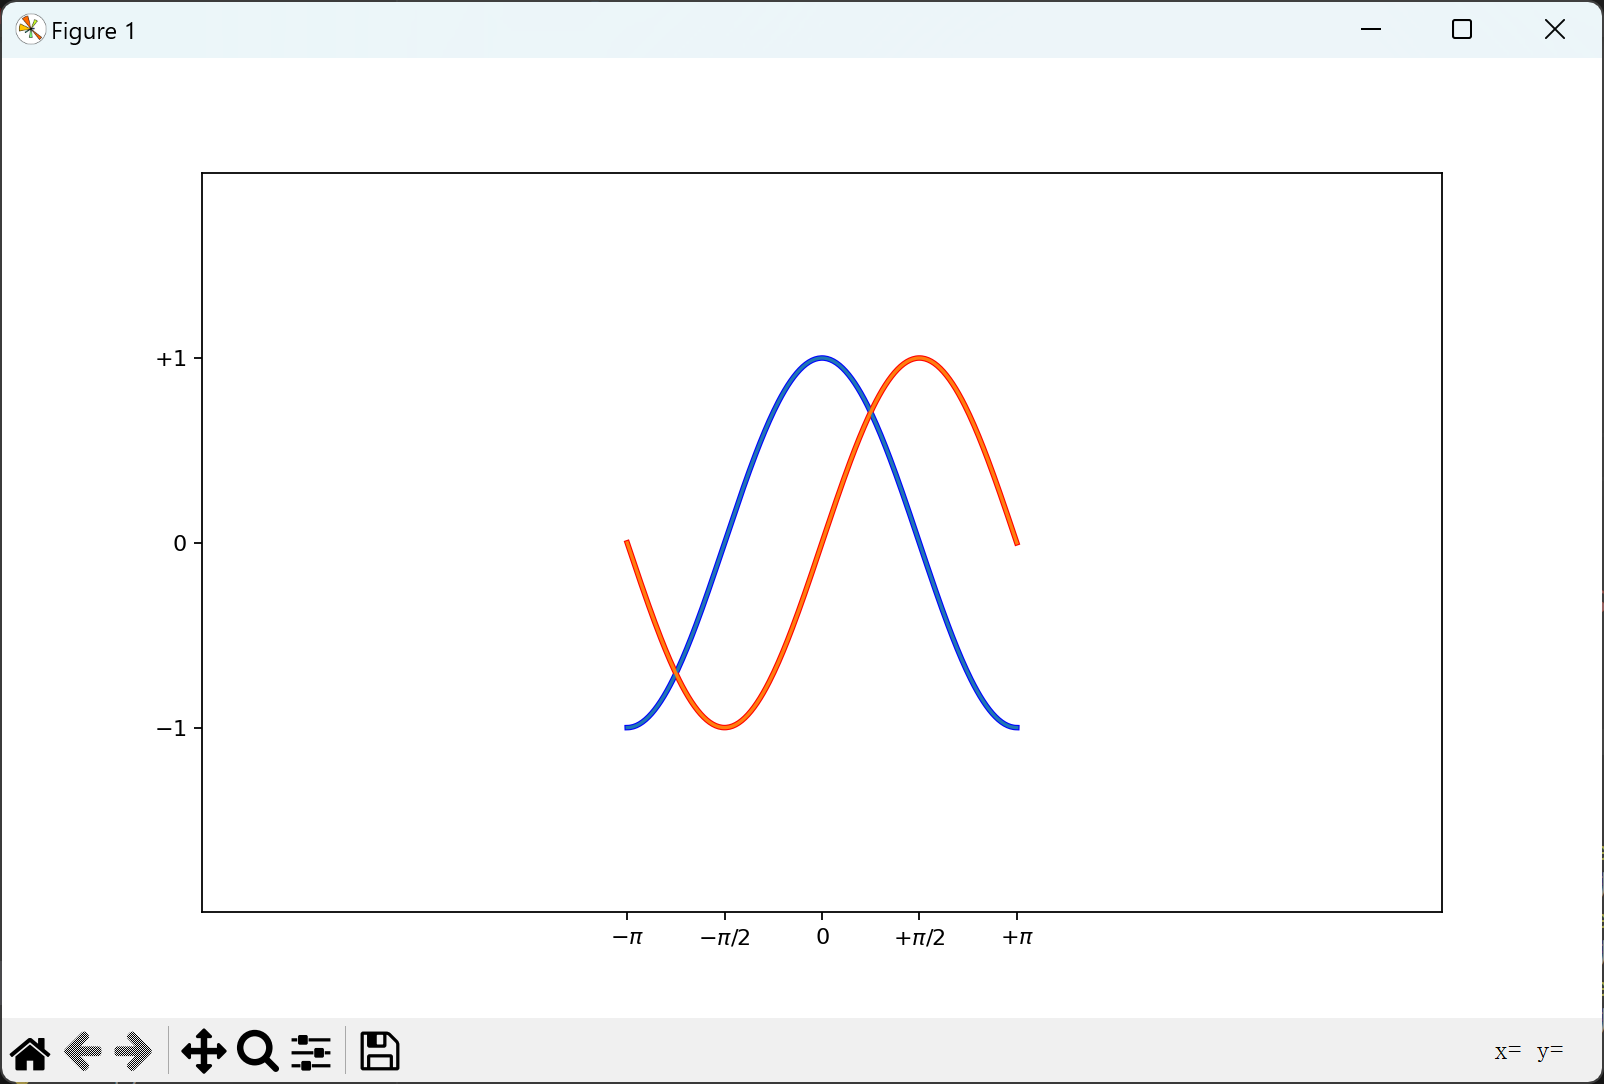
运行结果
移动轴线
from pylab import *

X = np.linspace(-np.pi, np.pi, 256, endpoint=True)
colors = [" blue", "green", "red", "cyan", "magenta", "yellow", "black"]
C, S = np.cos(X), np.sin(X)
figure(figsize=(10, 6), dpi=80)
plot(X, C, color="blue", linewidth=2.5, linestyle="-", label="cosine")
plot(X, S, color="red", linewidth=2.5, linestyle="-", label="sine")
plot(X, C)
plot(X, S)

# 设置边界值
xlim(X.min() * 1.1, X.max() * 1.1)
ylim(C.min() * 1.1, C.max() * 1.1)

# 设置数轴刻度范围
xlim(-10.0, 10.0)
ylim(-2.0, 2.0)

# 设置刻度标签
xticks(
    [-np.pi, -np.pi / 2, 0, np.pi / 2, np.pi],
    [r"$-\pi$", r"$-\pi/2$", r"$0$", r"$+\pi/2$", r"$+\pi$"],
)
yticks([-1, 0, +1], [r"$-1$", r"$0$", r"$+1$"])

# 移动轴线
ax = gca()
ax.spines["right"].set_color("none")
ax.spines["top"].set_color("none")
ax.xaxis.set_ticks_position("bottom")
ax.spines["bottom"].set_position(("data", 0))
ax.yaxis.set_ticks_position("left")
ax.spines["left"].set_position(("data", 0))

show()
运行结果
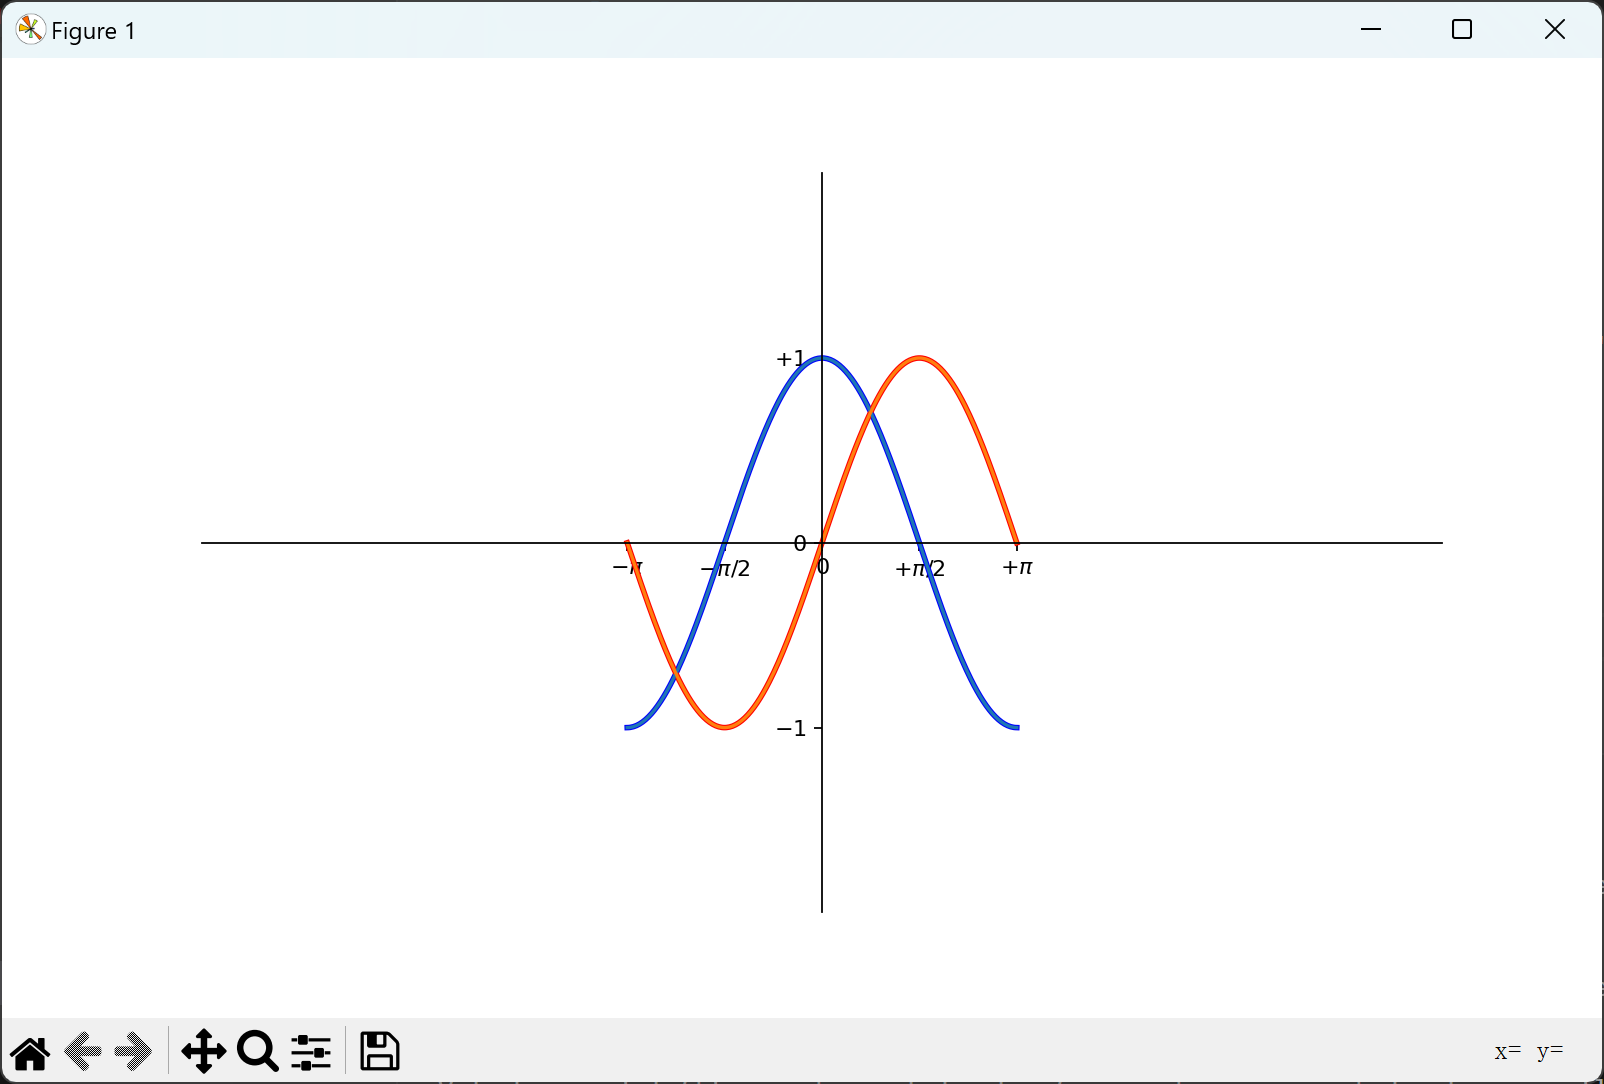
添加图例
from pylab import *

X = np.linspace(-np.pi, np.pi, 256, endpoint=True)
colors = [" blue", "green", "red", "cyan", "magenta", "yellow", "black"]
C, S = np.cos(X), np.sin(X)
figure(figsize=(10, 6), dpi=80)
plot(X, C, color="blue", linewidth=2.5, linestyle="-", label="cosine")
plot(X, S, color="red", linewidth=2.5, linestyle="-", label="sine")

# 添加图例
legend(loc="upper left")

plot(X, C)
plot(X, S)

# 设置边界值
xlim(X.min() * 1.1, X.max() * 1.1)
ylim(C.min() * 1.1, C.max() * 1.1)

# 设置数轴刻度范围
xlim(-10.0, 10.0)
ylim(-2.0, 2.0)

# 设置刻度标签
xticks(
    [-np.pi, -np.pi / 2, 0, np.pi / 2, np.pi],
    [r"$-\pi$", r"$-\pi/2$", r"$0$", r"$+\pi/2$", r"$+\pi$"],
)
yticks([-1, 0, +1], [r"$-1$", r"$0$", r"$+1$"])

# 移动轴线
ax = gca()
ax.spines["right"].set_color("none")
ax.spines["top"].set_color("none")
ax.xaxis.set_ticks_position("bottom")
ax.spines["bottom"].set_position(("data", 0))
ax.yaxis.set_ticks_position("left")
ax.spines["left"].set_position(("data", 0))

show()
运行结果
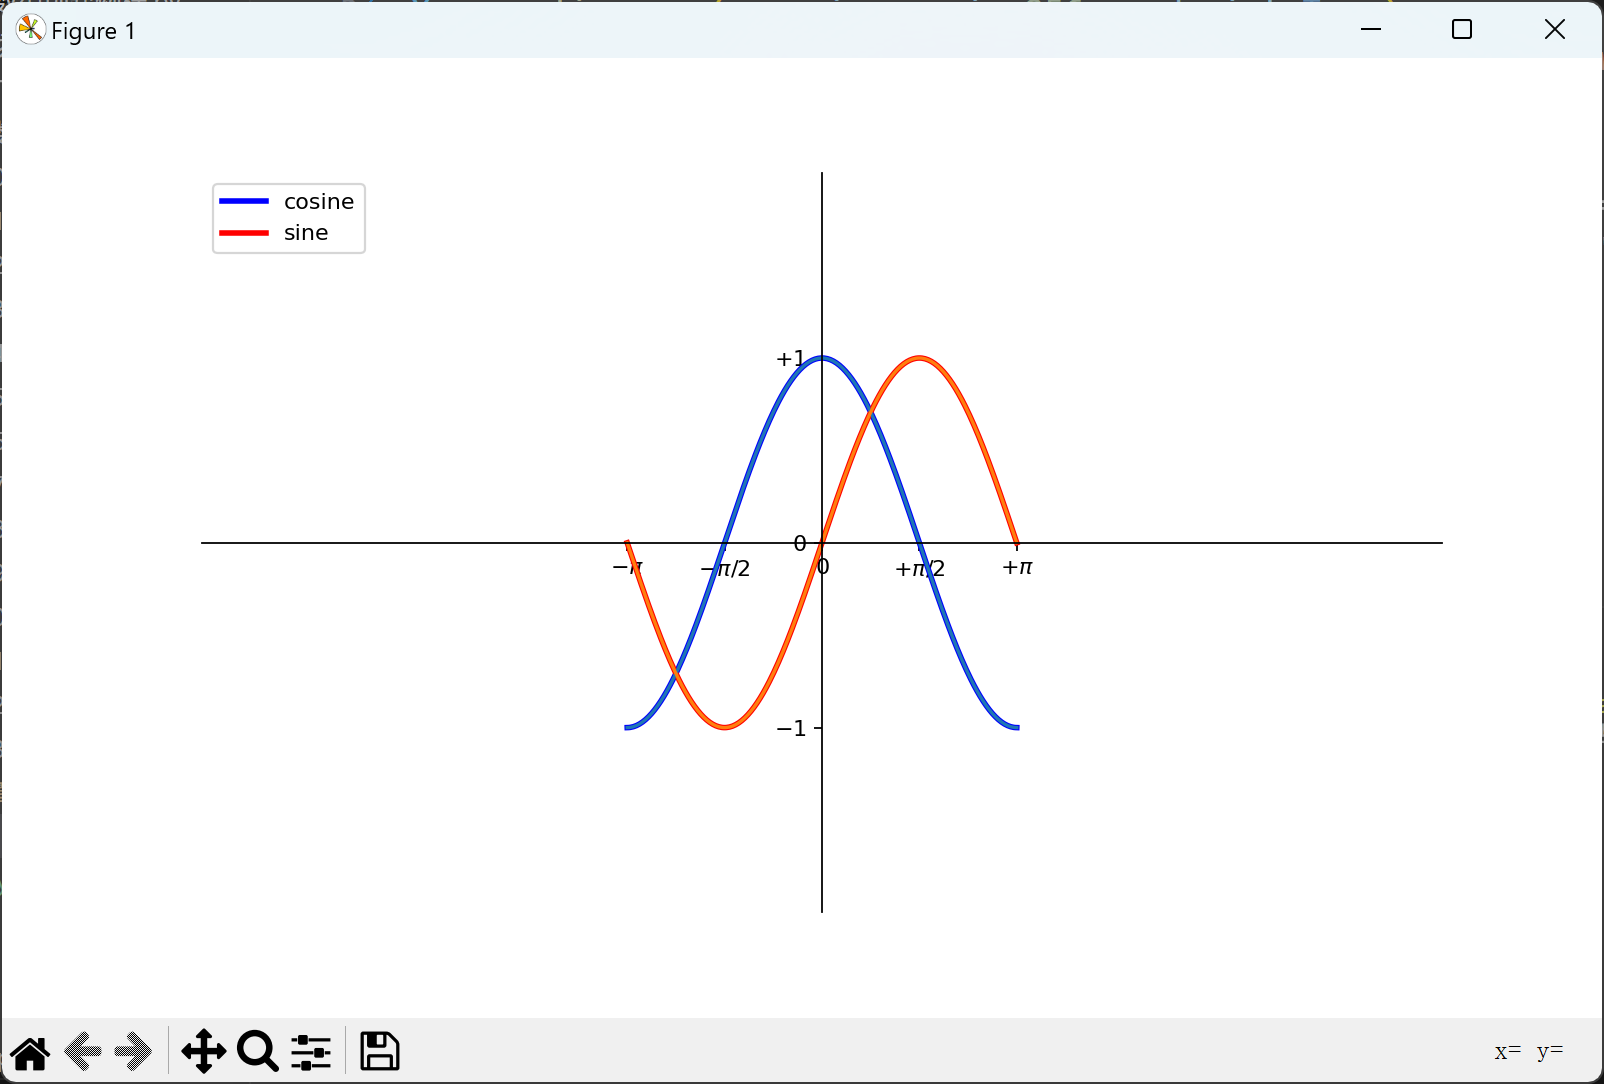
注解某些点
from pylab import *

X = np.linspace(-np.pi, np.pi, 256, endpoint=True)
colors = [" blue", "green", "red", "cyan", "magenta", "yellow", "black"]
C, S = np.cos(X), np.sin(X)
figure(figsize=(10, 6), dpi=80)
plot(X, C, color="blue", linewidth=2.5, linestyle="-", label="cosine")
plot(X, S, color="red", linewidth=2.5, linestyle="-", label="sine")

# 添加图例
legend(loc="upper left")

plot(X, C)
plot(X, S)

# 设置边界值
xlim(X.min() * 1.1, X.max() * 1.1)
ylim(C.min() * 1.1, C.max() * 1.1)

# 设置刻度标签
xticks(
    [-np.pi, -np.pi / 2, 0, np.pi / 2, np.pi],
    [r"$-\pi$", r"$-\pi/2$", r"$0$", r"$+\pi/2$", r"$+\pi$"],
)
yticks([-1, 0, +1], [r"$-1$", r"$0$", r"$+1$"])

# 移动轴线
ax = gca()
ax.spines["right"].set_color("none")
ax.spines["top"].set_color("none")
ax.xaxis.set_ticks_position("bottom")
ax.spines["bottom"].set_position(("data", 0))
ax.yaxis.set_ticks_position("left")
ax.spines["left"].set_position(("data", 0))

# 注解某些点
t = 2 * np.pi / 3
plot([t, t], [0, np.cos(t)], color="blue", linewidth=2.5, linestyle="--")
scatter(
    [
        t,
    ],
    [
        np.cos(t),
    ],
    50,
    color="blue",
)
annotate(
    r"$sin(\frac{2\pi}{3})=\frac{\sqrt{3}}{2}$",
    xy=(t, np.sin(t)),
    xycoords="data",
    xytext=(+10, +30),
    textcoords="offset points",
    fontsize=16,
    arrowprops=dict(arrowstyle="->", connectionstyle="arc3, rad=.2"),
)
plot([t, t], [0, np.sin(t)], color="red", linewidth=2.5, linestyle="--")
scatter(
    [
        t,
    ],
    [
        np.sin(t),
    ],
    50,
    color="red",
)
annotate(
    r"$cos(\frac{2\pi}{3})=-\frac{1}{2}$",
    xy=(t, np.cos(t)),
    xycoords="data",
    xytext=(-90, -50),
    textcoords="offset points",
    fontsize=16,
    arrowprops=dict(arrowstyle="->", connectionstyle="arc3, rad=.2"),
)

show()
运行结果
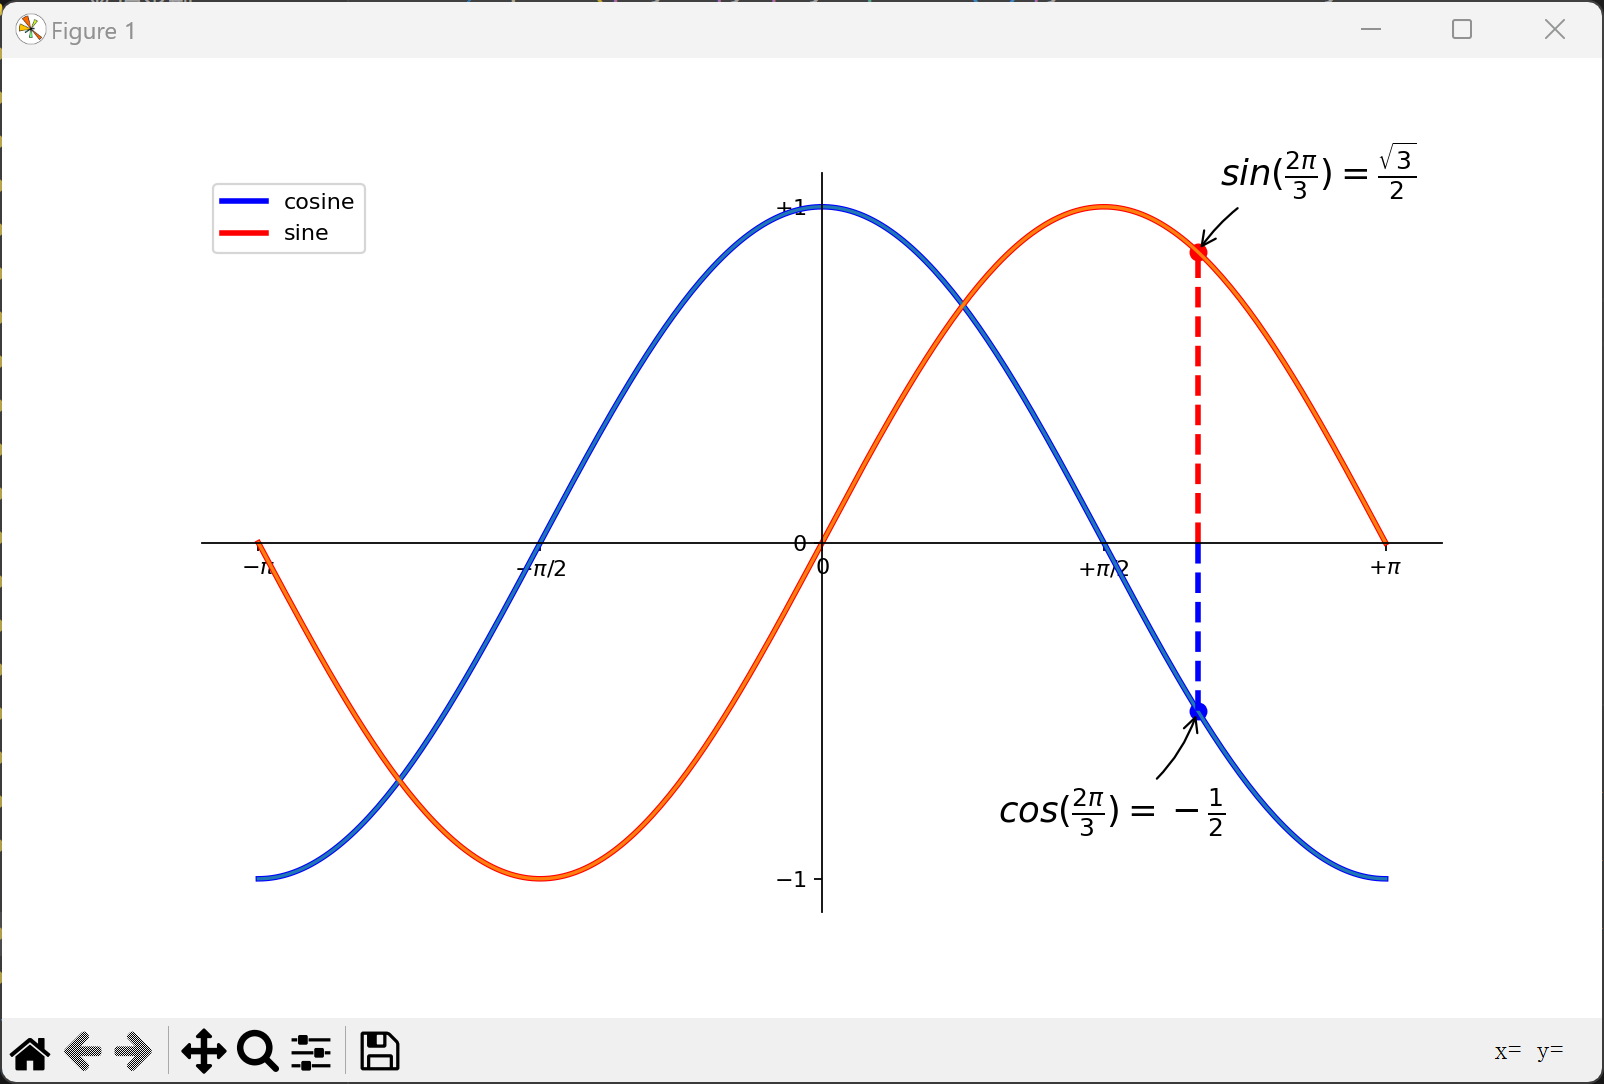
(未完待续。。。)